Body text
Thermal Infrared Satellite data
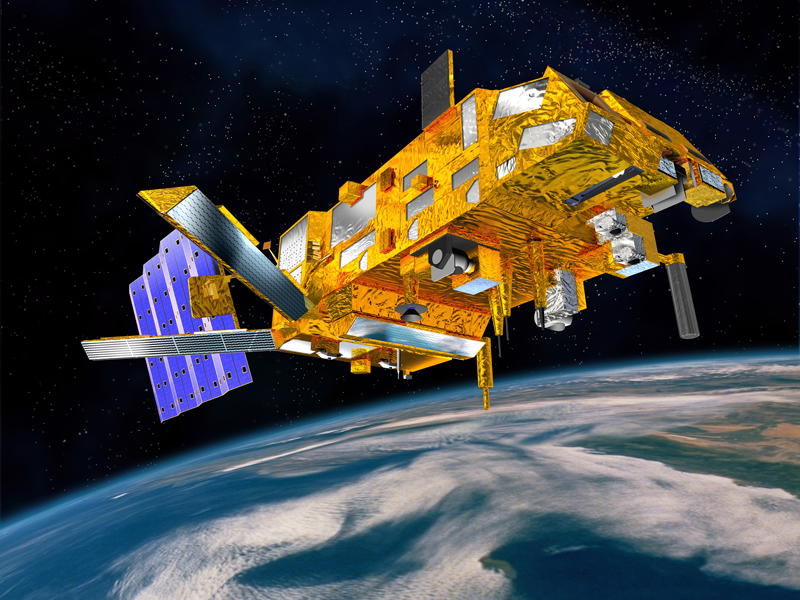
We use the data gathered by the Infrared Atmospheric Sounding Interferometer (IASI) onboard the EUMETSAT Metop satellite series since end 2006. IASI provides a high-resolution spectrum of the Earth-emitted (surface and atmosphere) radiations and reflected solar radiations from 3.62µm to 15.5µm.
To obtain dust 3D distributions we use the Thermal Infrared (TIR) part of that spectrum, with only Earth-emitted radiations. We even only use a part of the TIR where the atmospheric gases have a very low impact: around 9µm and 11µm. There, only clouds and certain types of particles (dust and ash) have a significant impact on the outgoing radiation.
Climate applications
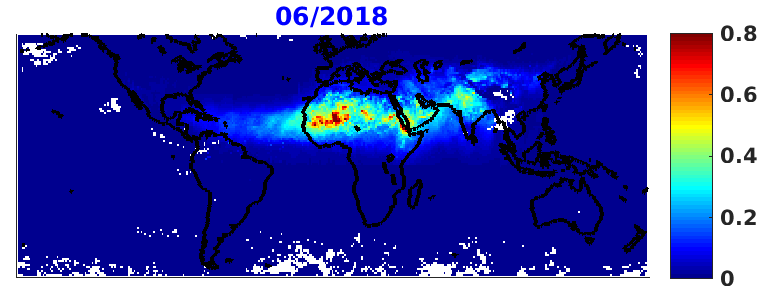
The results are illustrated in Figure 3 with the total column aerosol optical depth (AOD) at 10µm, representing the effect of all the particles in the air column, averaged over June 2018. The video shows, for a specific event in June 2015, the vertical distribution of the dust particles within a large plume.
Our unique data set of dust 3D distributions is currently used to try to discriminate locally emitted dust (in source areas) from transported dust, in order to improve the scientific knowledge of those source areas.
In the future, we intend to use this data to improve the modelling of the dust – cloud interactions, by a better representation of the dust distributions in the cloud models.