Satellites see a worldwide decrease in nitrogen dioxide pollution as a result of the COVID-19 crisis, China shows first signs of economic recovery
Scientists from the Royal Belgian Institute for Space Aeronomy (BIRA-IASB), in collaboration with the Royal Netherlands Meteorological Institute (KNMI) and the European Space Agency (ESA) have determined the extent to which the COVID-19 crisis has had an impact on air quality. The results were published on May 8, 2020, in the journal Geophysical Research Letters. For the press release below, the study period has been extended to May 4, 2020, a date that marks the start of the relaxation of measures in many countries. (Bauwens et al., Geophysical Research Letters, https://doi.org/10.1029/2020GL087978, 2020)
Now that COVID-19 measures are being relaxed in many countries, we would like to pay attention to the improved air quality in the last months. All over the world, countries have - to a greater or lesser extent - taken measures to reduce the spread of the coronavirus. In particular, transportation and people’s movements have been restricted worldwide. Traffic, the main source of nitrogen dioxide (NO2) in the urban environment, decreased significantly. This is now clearly visible on satellite images, as well as the decline in industrial activities, another important source of NO2 in the atmosphere.
TROPOMI is a measuring instrument on board ESA's Sentinel-5 precursor satellite, and it has been measuring NO2 concentrations - with a resolution of 3.5 x 5.5 km - on a daily basis around the world since 2017, allowing us to study NO2 concentrations worldwide, up to an urban level and in a relatively short period.
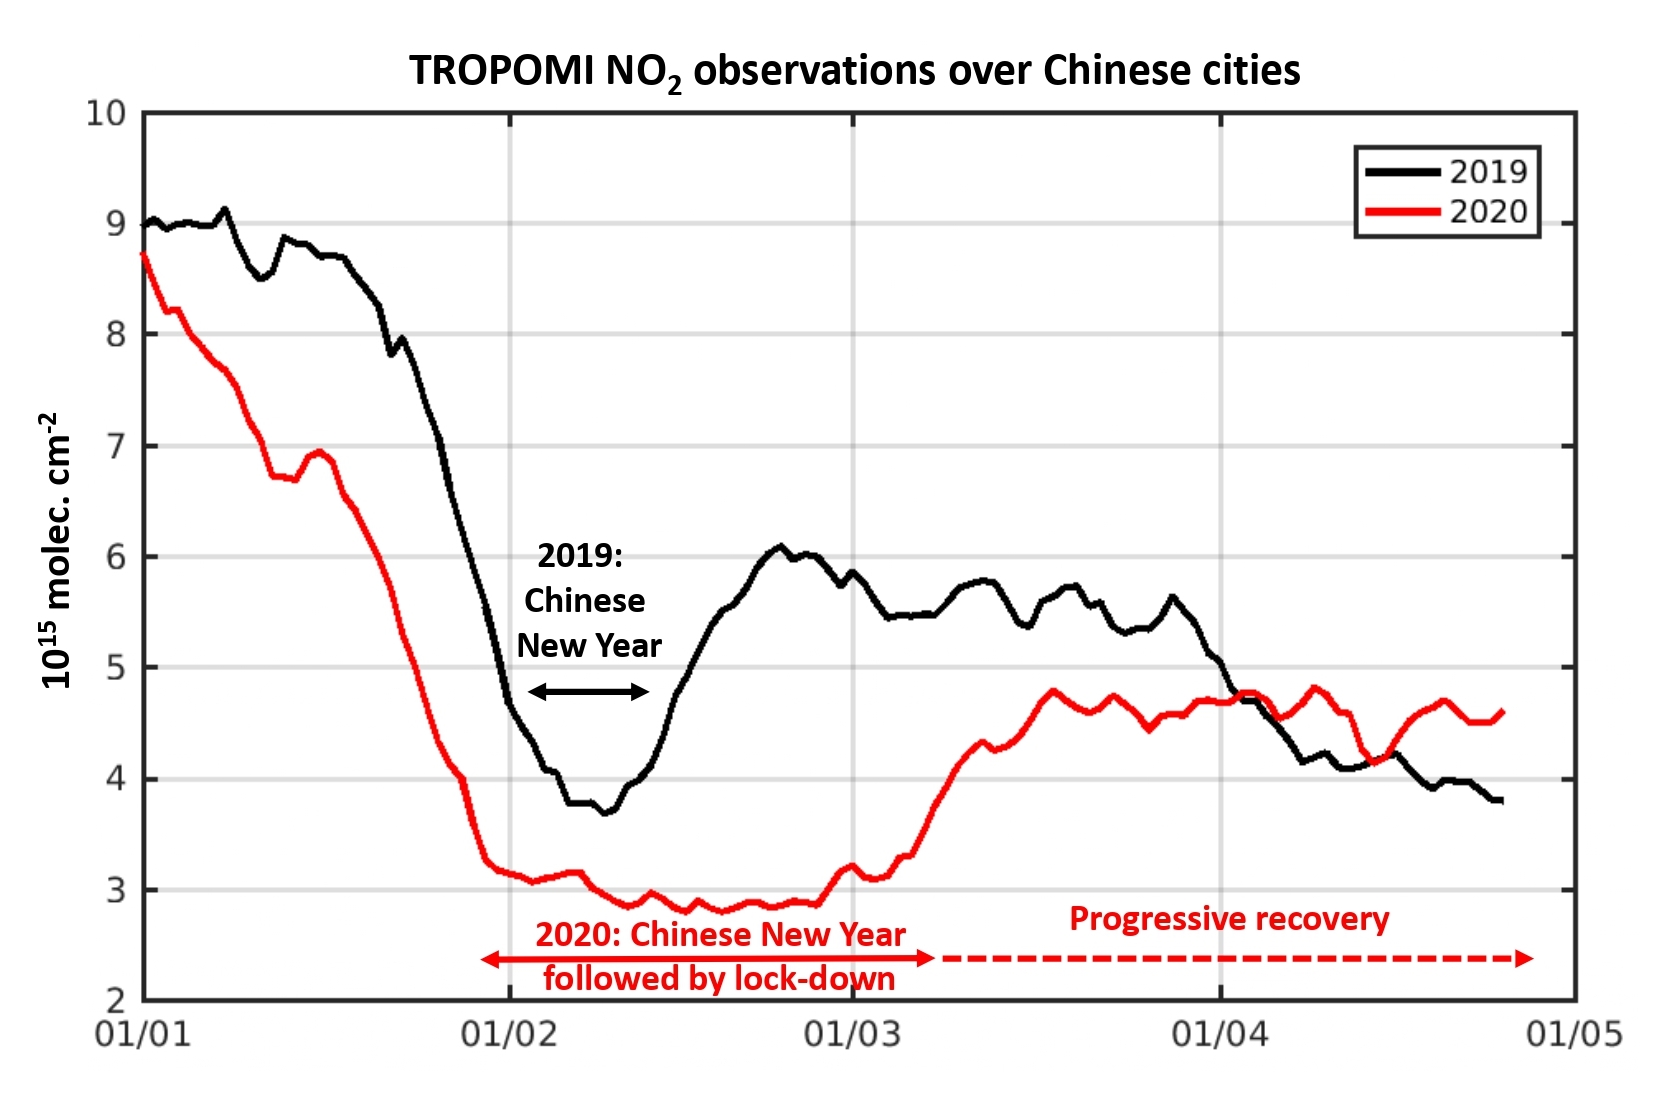
If we zoom in on some of the most affected regions, the data shows us how NO2 concentrations decreased during the crisis. In China, at the end of February, we observed a decrease in NO2 emissions of up to 70% in some cities, compared to last year. However, in the meantime, NO2 concentrations have risen again to values slightly higher than last year (see Figure 3).
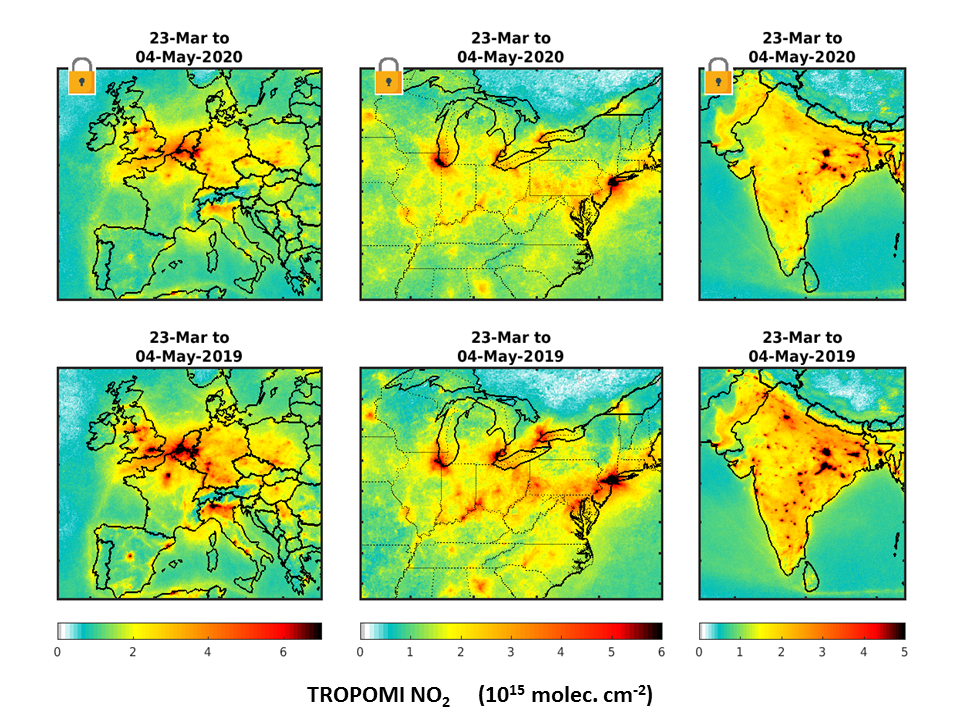
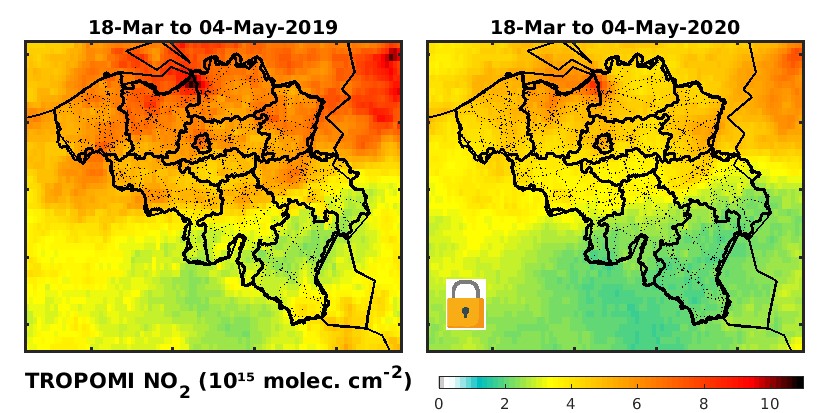
Around cities such as Milan, Barcelona and Madrid, TROPOMI observed NO2 concentrations that are 30% to 40% lower than last year. Around Paris, New York and in several Indian cities, reductions of about 30% could be observed. In most Belgian cities, just like in other European and North American cities, the reductions were around 20%-30%. In the city centres, the reductions were even higher (up to 50%).
These results were confirmed by independent observations from another measuring instrument, OMI - on board the Aura satellite - which has been making NO2 observations since 2005. This allows us to compare the current observations with similar measurements of the past 15 years. For some Chinese cities such as Wuhan and Nanjing, levels of NO2 as low as in the midst of the lockdown period are unprecendented.
It should be noted that NO2 concentrations are sensitive to meteorological conditions, such as sunlight, temperature and wind, which can affect the lifetime of the gas in the atmosphere. Political and societal efforts to improve air quality can also lead to lower NO2 concentrations. Therefore, computer models will be used in the future in order to distinguish the effects of imposed COVID-19 measures from other factors.
Contact
- Dr. Maite Bauwens, Atmospheric Scientist in the research group “Tropospheric Chemistry Modelling”- Email: maite (dot) bauwens (at) aeronomie (dot) be
- Dr. Jenny Stavrakou, Atmospheric Scientist in the research group “Tropospheric Chemistry Modelling” - Email: trissevgeni (point) stavrakou (at) aeronomie (dot) be
- Dr. Karolien Lefever, Head of the Communication department – Email: karolien (dot) lefever (at) aeronomie (dot) be
Reference
Bauwens, M., S. Compernolle, T. Stavrakou, J.-F. Müller, J. van Gent, H. Eskes, P. F. Levelt, R. Van der A, J. P. Veefkind, J. Vlietinck, H. Yu, C. Zehner (2020), Impact of coronavirus outbreak on NO2 pollution assesses using TROPOMI and OMI observations, Geophysical Research Letters, https://doi.org/10.1029/2020GL087978.
News image 1
News image legend 1
News image 2
News image legend 2
News image 3